REST version : v2.2.10
Hi:
When l input this code below,it will run for long time,and l don’t know the reason.In details, the New_gas_Xe136bb0n01PlusM1.root is the output of restG4 where each event contains two electron(total energy=879keV)and two gamma(gamma1=760keV,gamma2=819keV)
The result:
It is very very slow:A event needs about 5~10 minutes.So maybe there are
some mistakes in TRestHitsToTrackProcess though there is still an output .root.
The details:
the processes of config.rml
l just open the processes in the config.rml one by one until the TRestSignalToHitsProcess.
config.rml (4.3 KB)
readouts.rml (16.5 KB)
The related input root file:
 New_gas_Xe136bb0n01Plus…
https://jbox.sjtu.edu.cn/l/dn1hgF
Hi Xie,
please, disable all processes after TRestSignalToHitsProcess. Then, run the processing, I guess this will take not long time for 100 events. Then, could you check the number of hits on the generated output and add a screenshot of the hits event view in your reply? I am curious about that.
Under some conditions it might happen that this process is very slow. It checks all hit inter-distances and the computation grows quickly.
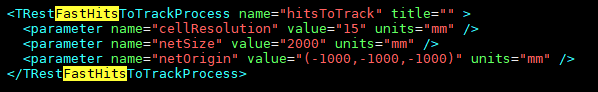
You might try TRestFastHitsToTrackProcess it does the same but it uses a regular grid, adds the hits to the grid in one loop, and associates neighbour grid cells to a common track. It is faster. You may chose the cell size to fine tune the accuracy and computation time.
These are the parameters for that process.
You must define a box using
netOrigin, and
netSize that covers all the active volume, where your hits are present. Then, the size of each cell in
cellResolution.
Yeah.Each time l open a process, l run 100 events and the program is OK until l open the TRestHitsToTrackProcess.
After disabling all processes after TRestSignalToHitsProcess and running the .rml again, the number of hits on the generated output is
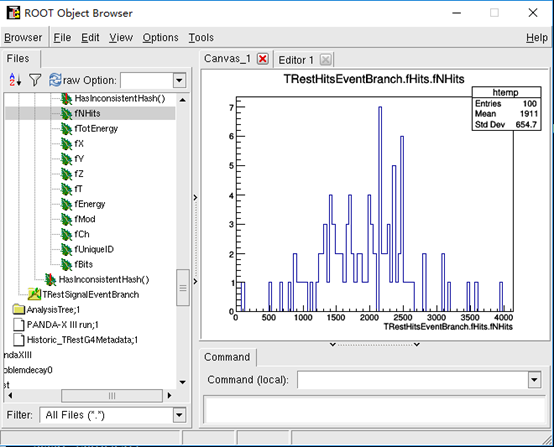
And the hits event view:
It does work after l close TRestHitsToTrackProcess and open TRestFastHitsToTrackProcess.
Howover, when l continue to open the next TRestTrackAnalysisProcess,the same problem happens:it still runs for long time.
The number of hits seems reasonable. Are you sure then the original problem was not at TRestTrackAnalysisProcess?
If debug mode is enabled for TRestRun section I think the times spent in each process should be printed out in screen. It is the case @nkx? Or process times are printed by other means?
What are the typical times spent in each process?
Sorry, l forgot to reply you last time and the problem was solved while l did not change anything.
l don’t know what happened but it runs normally now.

 New_gas_Xe136bb0n01Plus…


